Lecture Capture - Analytics guide
This guide provides an overview of the Lecture Capture systems' Analytics section, as well as best practice for viewing and using the information provided.
This guide provides an overview of the Lecture Capture systems' Analytics section, as well as best practice for viewing and using the information provided. Echo360 also provide detailed information regarding analytics, see their course analytics overview.
Accessing the analytics page
To access analytics for your subject, navigate to the Analytics tab within the Echo360 classroom for your subject.

Classes
Once you have selected the Analytics tab, you will be presented with the Classes page. The Classes page provides an overview of analytics for the selected subject. By default, this section will show analytics for the whole subject (shown as "All Classes").
The timeline shows the Engagement Score and its components for each class based on the date of the recording. You can select the legend to highlight a particular metric or hide a metric by clicking in the coloured circle. Hovering over the graph will reveal raw data.

The Least Engaged Student table below the timeline provides a list of students with the lowest Engagement Score. Select the See All section to be taken to the Students analytics page.
The Confusing Content table provides a summary of content that students have flagged as confusing using the Confusion Flag feature. Further information on the Confusion Flag function can be found in the Echo360 - Extended Guide - Staff.
It is also possible to drill down to the individual lecture by selecting it from the drop down menu at the top of the page. The timeline now shows a 10 minute window at 30-second increments of the views, questions, confusion points and notes word count for that class. If presentation slides have been uploaded you can switch between video and presentation views using the drop down above the timeline.

Students
The Students page provides usage and participation statistics for each student and displays analytics for the whole subject ("All Classes") by default. To see analytics for an individual lecture, click the drop down menu and select the desired lecture.
The table is searchable using the search dialog at the top of the page. Each column can also be used to sort the table by clicking on the heading.
When looking at an individual class, a drop down is available at the top right to display metrics for video, presentation or all content. Note that the number of video views and the percentage of video viewed is only available through the video option.

Engagement
The Lecture Capture system refers to Engagement throughout the analytics section, and also the wider system. The Engagement Score is a combination of 6 different metrics, which can be weighted to suit your own reporting preferences. A summary of the different metrics is provided below:
| Attendance | Measures if the student was active in the Echo360 "classroom" during the scheduled recording time. Note that this is not physical attendance and should not be used as an attendance measure. |
|---|---|
| Video Views | Mounts the number of times a student viewed a recording. Where this value appears for all classes it is a cumulative value. |
| Presentation views | Counts the number of times a student viewed the presentation slides. This requires the presentation slides to be uploaded to the classroom. |
| Q&A | Counts participation in the Question and Answer feature. This requires the Q&A feature to be turned on. |
| Notes | Counts the number of words taken in notes. |
| Activities | Counts the participation in classroom activities (eg in-class polls and quizzes). This requires classroom activities to be added and used within the Lecture Capture system. |
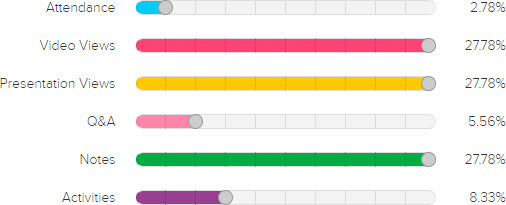
Engagement Score Metric Weightings
The Engagement Score Metric Weightings allows you to adjust the weighting of the Engagement Score in your subject by sliding each metric to a particular % level. Changes applied here will be made on your selected subject only. Any further changes will also need to be made on all other subjects. Note that this change will also impact other staff viewing the analytics for this subject.
For further information on the engagement score and how it can be interpreted, view the information found in the Echo360 guide: Definitions of course analytics metrics.
Metric Correlation Graph
The Engagement section also provides the ability to upload external grades to the Lecture Capture system. The purpose of this is to view the correlation between the Engagement Score and external grades. This function is not currently supported.
Export & Gradebook
Export
All of the analytics available to instructors within the Lecture Capture system can also be downloaded as a CSV file via the analytics export function. To access this section, in your desired course, select the Analytics tab and then select the Export & Gradebook menu on the right hand menu bar.

The below reports are currently available for export:
| Activity Participation (%) | Provides a percentage of participation based on total activities for each student at each lecture. |
|---|---|
| Activity Participation (Raw #) | Provides the number of activities that the student has participated in for each lecture. |
| Activity Score (%) | Provides a percentage score which represents correct answers to activities for each student at each lecture. |
| Activity Score (Raw #) | Provides the activity score as a number, for each student in each lecture. |
| Attendance | Provides an attendance count for each student at each lecture. The student is considered to have attended a class if they are actively using the system during the scheduled recording time. |
| Engagement | Provides an Engagement score for each lecture per student. For more information on the engagement score, see the 'What is Engagement?' section below. |
| Notes word count | Provides a word count for the Note taking function on each recording for each student. |
| Presentation Views | Provides a count of presentation views for each lecture for each student. This report requires that individual presentation slides are uploaded for each lecture. |
| Questions | Provides a count of questions for each lecture for each student. This report requires the Q&A feature to be active. |
| Video Views | Provides a count of video views for each lecture for each student. |
Gradebook
The Gradebook function provides the ability to export some metrics back to the LMS. This function is not currently supported.
This guide was last updated 20 Nov 2023.
Please report any errors or omissions in this guide by submitting an LMS support request.